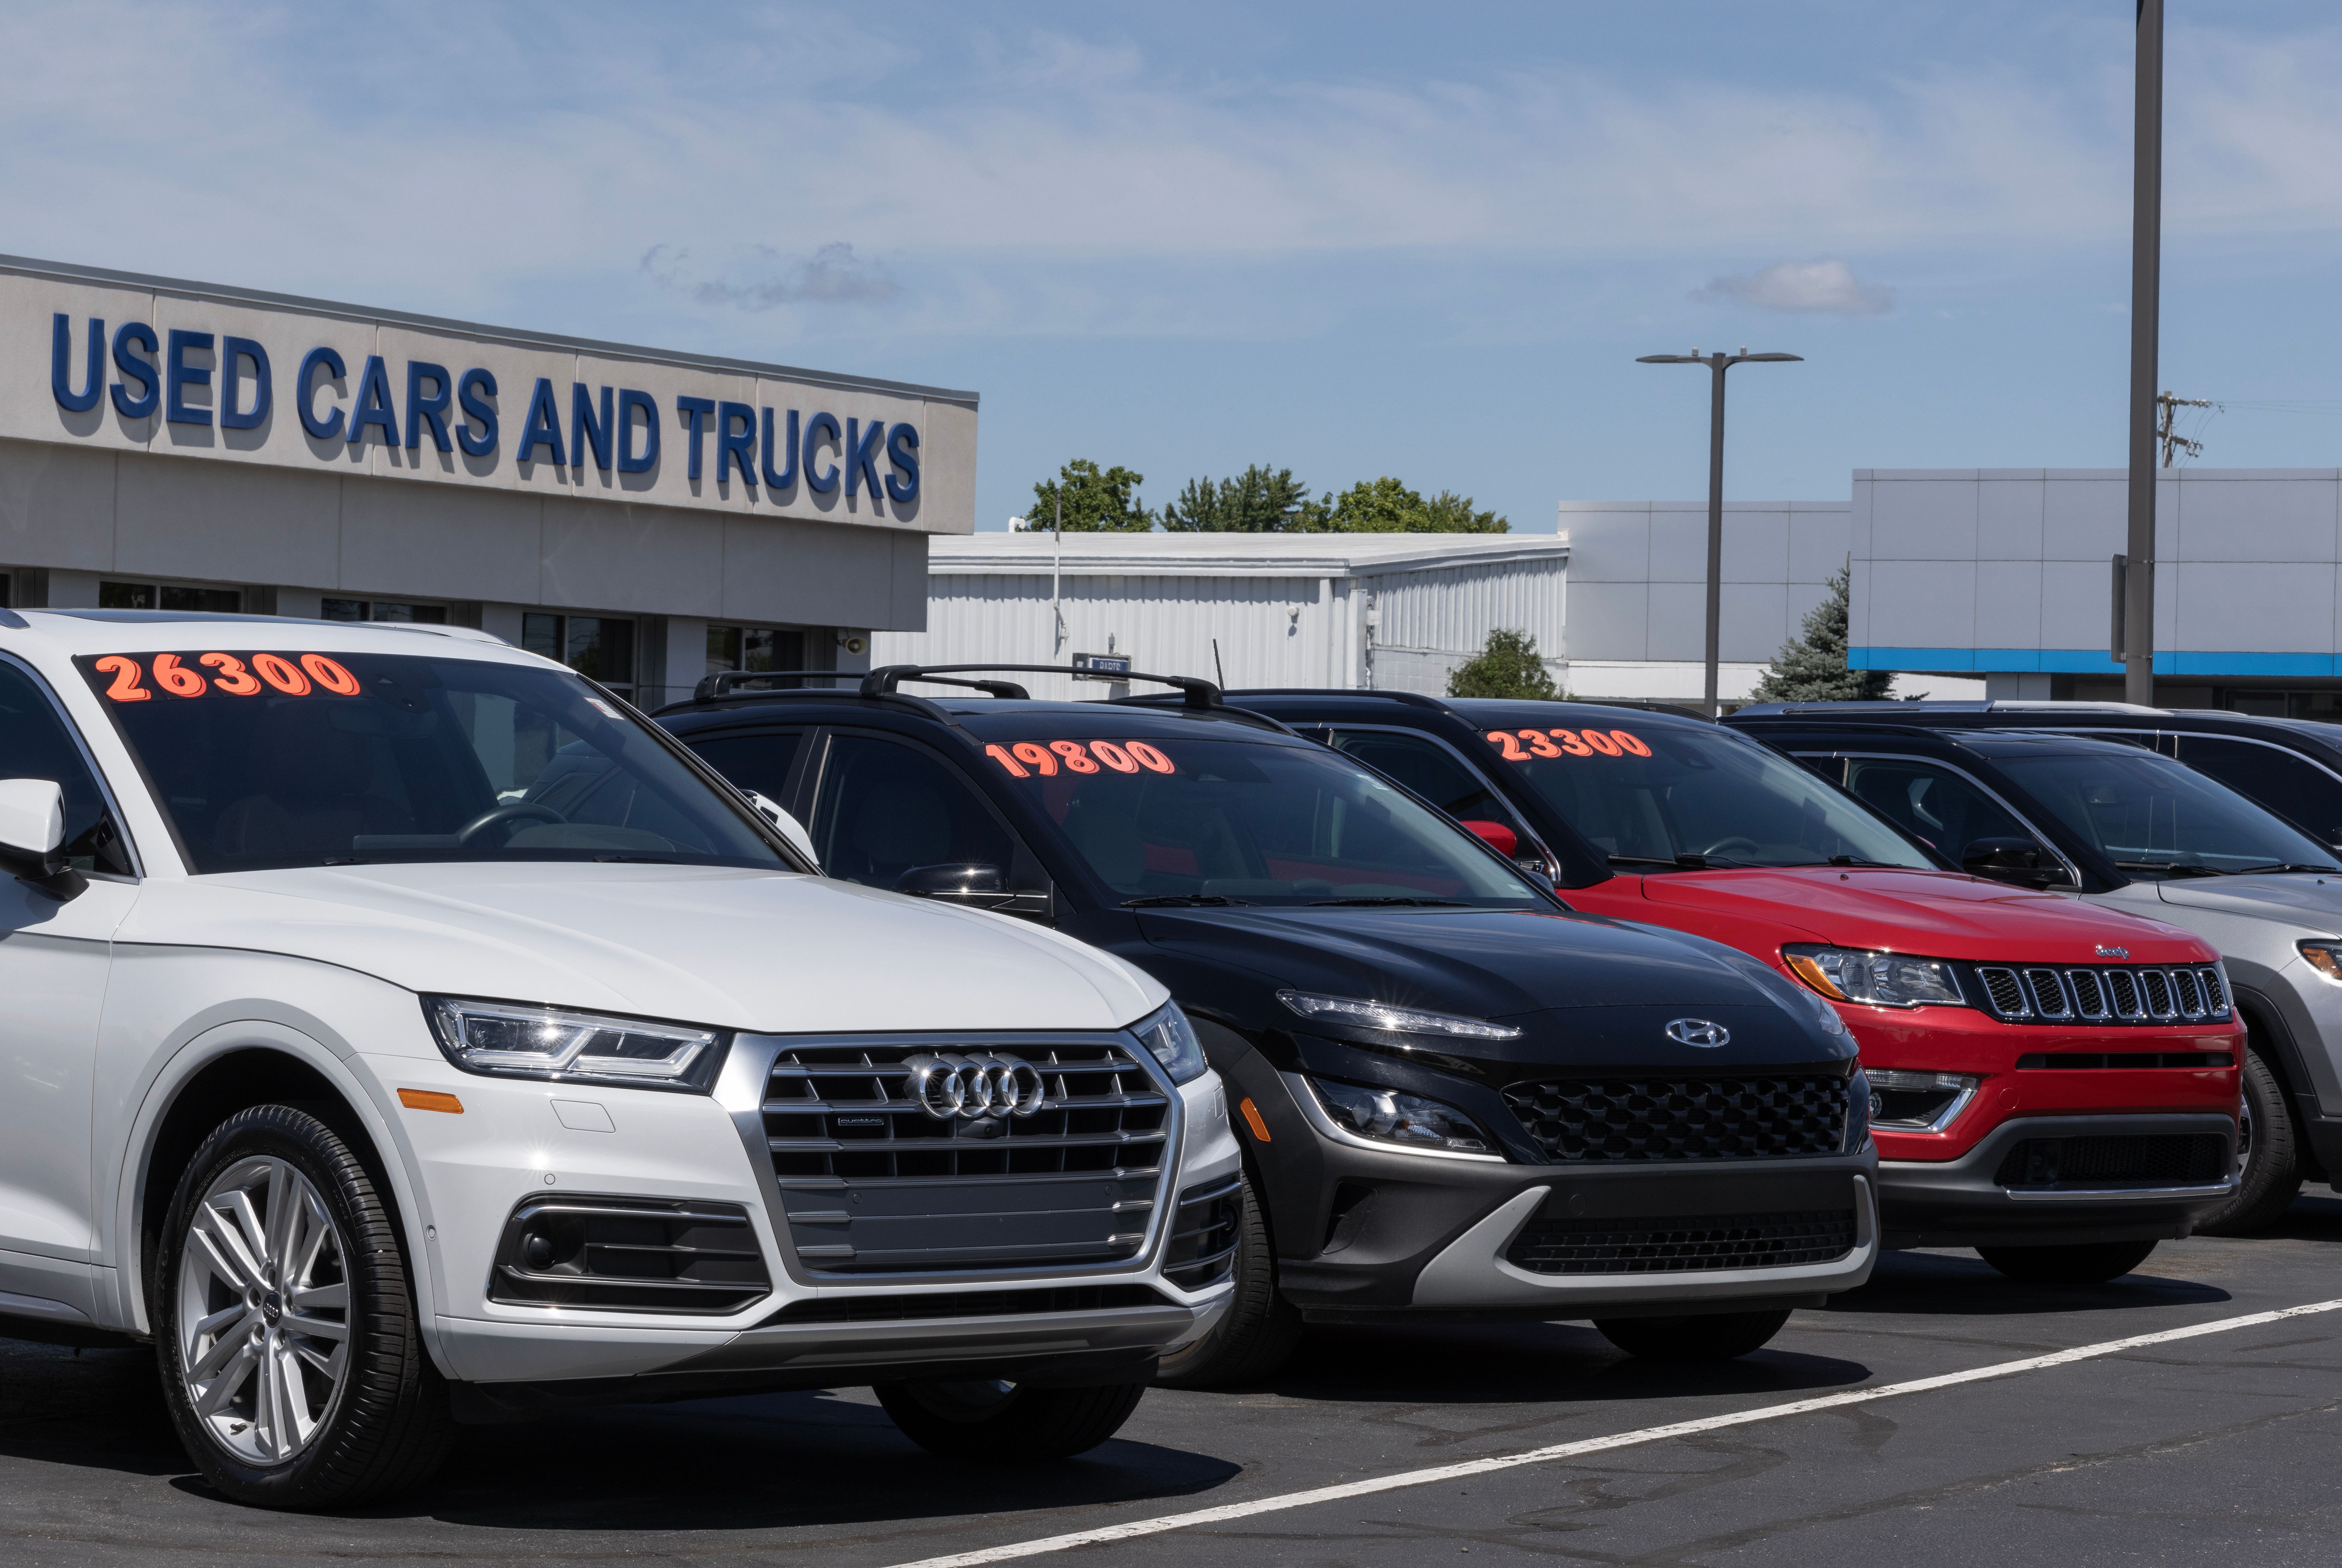
The standard advice for buying a used car is simple enough to fit on a bumper sticker: wait for the depreciation cliff, then buy. Most guides put that moment somewhere around year four of a car’s life. The car has already shed the bulk of its value, the logic goes, but it is not old enough to be a reliability problem. Year four is the sweet spot.
It is a reasonable argument. It is also incomplete, in a way that costs buyers money every year.
The depreciation data and the repair cost data tell a more complicated story when you look at them together. Year five is when depreciation genuinely flatlines. It is also when repair costs jump by 31.2% in a single year, the sharpest spike in the ownership curve before year eight. A buyer who enters at year four does not avoid that spike. They buy the car and then live through it twelve months later, spending more than they thought they were saving by buying used.
Year five buying is better. The depreciation math fully works in your favor, and you are entering at the floor rather than just above it. But the year-five owner still absorbs that repair surge as a current owner. Year six is where both problems are behind you.
That distinction matters more than most buyers realize. Before committing to any used car purchase, run a Bumper VIN check to see the ownership details and mileage history on the specific vehicle you are considering. What follows explains why the year of purchase is only half the equation and what the other half looks like.
What Used-Car Buyers Actually Believe About Vehicle Age
Before getting into what the data says, it is worth knowing what buyers think. A survey of 2,168 Bumper users asked a single question: at what age does a used car become too risky to buy? The most common answer, chosen by 59% of respondents, was not age at all; it was that mileage and history mattered more. The second top choice was 8-10 years old, followed by 11-15 years old.
The Depreciation Cliff: What the Numbers Actually Show
The average new car costs $48,841, according to MoneyGeek. In the first year of ownership alone, it loses roughly 20–30% of that value — somewhere around $12,000 gone before the first scheduled oil change. By year three, the retained value has fallen to approximately $26,900. By years five and six, it stops falling and plateaus around $22,000. These figures come from applying the Get A First Life whole-market depreciation curve to MoneyGeek’s average new car price, and while the specific dollar amounts scale with the baseline price, the shape is consistent across general-market data sources.
Once a car reaches its depreciation floor, it sheds only about $1,000 to $1,500 per year from that point forward. The first owner has absorbed roughly $26,000 in losses. Those losses are permanent. The buyer who arrives at year five or six does not pay for any of them.
The annual loss rate makes the shape of this visible. At year one, it is running at roughly 25%. By year three it has dropped to about 12%. By years five and six it is sitting at approximately 6% per year and still flattening. That is the depreciation cliff: steep in the early years, nearly flat by the time year five arrives.
On average, year five is the first point at which the depreciation argument is fully won. The floor has been reached. The rate of loss is minimal. But there is a second curve that year-four buyers tend not to look at, and it runs in the opposite direction.
The Repair Spike That Year-Four Advice Ignores
Per-vehicle repair and maintenance costs for single-vehicle households show two distinct spikes across the 1-to-15-year ownership range. The first is at year five. The second is at year eight. Neither is small.
The Repair Cost Curve
The repair-cost data shows two major inflection points during ownership.
Year 4
- Average repair cost: ~$432/year
- Status: Baseline before major repairs
Year 5
- Average repair cost: ~$761/year
- Increase: +31.2%
- What it means: The first major repair spike.
Years 6–7
- Repair costs stabilize.
- This is the calmest ownership period before the next jump.
Year 8
- Average repair cost: ~$1,079/year
- Increase: +59.4%
- What it means: The largest repair-cost increase in the first fifteen years of ownership.
A year-four buyer is entering one year before that 31.2% spike. This is framed as the smart move by buying just before costs rise. The problem is that ownership does not end at the moment of purchase. Within twelve months, the year-four buyer is the current owner living through a repair cost surge that was entirely predictable and is not a surprise to anyone who looked at the data.
The year-five buyer does absorb the spike. But they absorb it as the owner who bought at the depreciation floor, not as someone who paid close to full depreciated value a year earlier and then watched costs jump. The math is meaningfully different.
The year-six buyer absorbs neither. The spike happened to whoever owned the car through year five. The year-six buyer enters the stable corridor and relatively quiet stretch between the year-five jump and the year-eight cliff. The vehicle has already hit its value floor and already survived its first major repair event.
What Year Six Actually Buys You
The case for year-six buying has three components, and each one is independent of the others.
Depreciation is fully absorbed. The floor on an average car is approximately $22,000 by year five. A year-six car is shedding roughly $1,000 to $1,500 per year from that point. That’s a rate low enough that waiting an extra year to buy costs almost nothing in value terms, and saves you exposure to the repair spike.
The year-five repair surge already happened to someone else. The previous owner absorbed the 31.2% jump. It is priced into their willingness to sell. It is not something you will absorb as a new owner, because it is already in the rearview mirror for this vehicle.
Years six and seven are the calmest stretch in the ownership curve. After the year-five spike and before the year-eight cliff, the repair cost data shows a period of relative stability. That is your operating window. It lasts roughly one to two years before the next and larger inflection point arrives.
The Brand Problem: Year Six Is Not the Same for Every Car
The year-six argument comes with a caveat that most used-car guides omit entirely. Two cars sitting on the same lot, both six years old, both priced in a similar range, can be in fundamentally different positions relative to the end of their useful lives. The difference is not the condition. It is a brand tier.
The used-car market is divided into two groups whose longevity numbers are not close to each other.
Tier 1: Toyota, Lexus, Honda, Acura
- Lifespan: 19.6 years
- Retirement mileage: 180,873 miles
- Average daily driving: 25.3 miles/day
Tier 2: Mazda, Subaru, Hyundai, Kia, GMC, Chevy, Ford, Nissan
- Lifespan: 16.8 years
- Retirement mileage: 155,862 miles
- Average daily driving: 25.4 miles/day
The daily usage intensity is almost identical: 25.3 miles per day for Tier 1, 25.4 for Tier 2. These cars are being driven the same amount. The difference is not how they are used. It is how long they survive that use. Tier 1 vehicles run for 19.6 years and 180,873 miles. Tier 2 vehicles retire nearly three years and 25,000 miles earlier.
That gap reshapes the year-six argument significantly.
A six-year-old Tier 1 car has used roughly a third of its expected lifespan. It sits comfortably in the stable corridor described above, with meaningful life ahead of it and a mathematically clear position relative to its own retirement. A six-year-old Tier 2 car is at or past its halfway point. The year-eight cliff is coming sooner relative to where it is in its own lifecycle. The runway between year six and vehicle retirement is shorter, and there is less room for the repair costs that come with that trajectory.
The mileage checkpoint data makes this visible in concrete terms.
68,000 miles
- Tier 1 life remaining: 62%
- Tier 2 life remaining: 56%
- Difference: +6 percentage points
105,000 miles
- Tier 1 life remaining: 42%
- Tier 2 life remaining: 32%
- Difference: +10 percentage points
128,000 miles
- Tier 1 life remaining: 29%
- Tier 2 life remaining: 17%
- Difference: +12 percentage points
The gap widens as mileage climbs. At 68,000 miles, roughly where a year-four or year-five car tends to land, Tier 1 has six more percentage points of life remaining than Tier 2. By 105,000 miles, it is ten points. By 128,000 miles it is twelve points, and the Tier 2 car has only 17% of its expected life left.
The year-six sweet spot is real. It is also largely a Tier 1 argument. For Tier 2 vehicles, the same window exists. The repair corridor is still there, the depreciation floor is still in play, but the runway is shorter, the margin for error is smaller, and the exit before year eight becomes more urgent. A year-six Tier 2 purchase is not a bad decision. It is a different decision, and it should be modeled as one.
What to Do Before You Buy
The data above points toward five questions every used-car buyer should answer before signing anything. A test drive answers none of them.
- Confirm the tier. Is the vehicle a Tier 1 brand: Toyota, Lexus, Honda, or Acura? If yes, the year-six argument applies with full force. If it is a Tier 2 brand, the window is real but the hold period is shorter and the exit timing matters more.
- Confirm the age against the repair curve. Years six and seven are the target window. Year five is an acceptable entry point, the depreciation math is fully in your favor, but you are entering at the moment of the spike rather than after it. Year eight is where the next major cliff arrives, at +59.4%. Buying at year seven leaves very little runway before that event.
- Check the mileage against the tier baseline. At approximately 105,000 miles, a Tier 1 car should have roughly 42% of its life remaining. A Tier 2 car at the same odometer has about 32%. If the asking price does not reflect that difference, it should.
- Price against the depreciation floor. The floor on an average car is approximately $22,000 by year five or six. A listing priced significantly above that number warrants scrutiny. The depreciation curve does not support it unless there is a specific condition or provenance reason.
- Run the vehicle history before the test drive, not after. A Bumper VIN check can show the ownership timeline, mileage records across every registration period, and documented history of that specific vehicle. If previous owners held the car for unusually short periods around the year-five spike, that pattern is worth understanding. The physical inspection tells you what the car looks like today. The vehicle history report can tell you what it might have been through and how many people have decided to move on from it.
The Bottom Line
The year-four recommendation is not wrong. It is just working with half the data. It accounts for the depreciation curve and stops there. It does not account for the repair cost curve that runs alongside it, or the way those two curves interact to create a window that opens later than most guides acknowledge.
Year five is the first point at which the depreciation math is fully resolved. Year six is the first point at which both the depreciation and the repair spike are behind the vehicle rather than ahead of it. That is the distinction that matters, and it is not a subtle one.
The brand tier caveat applies throughout. The year-six window is widest and most forgiving for Tier 1 vehicles, where substantial life remains and the margin for error is larger. For Tier 2 vehicles, the window is real but the timing of entry and exit both require more precision.
The data does not describe a product that works the same way for everyone at the same age. It describes a set of curves, depreciation, repair costs, and remaining life, that interact differently depending on what you are buying and when. Understanding those curves before you buy is the work. A Bumper VIN check on the specific vehicle is how you apply them to the actual car in front of you.
Data & Methodology
The findings in this piece come from two separate analyses combined on the same age axis.
The depreciation curve comes from getafirstlife.com, applied to a $48,841 average new-car price from MoneyGeek. The repair cost figures come from the 2024 BLS Consumer Expenditure Survey, specifically, households that own one vehicle, so the costs map cleanly to a single car rather than being spread across a garage. Those two curves, plotted together by vehicle age, produce the buy-window finding.
The buyer perception data comes from a Hotjar survey of 2,168 site visitors asking "At what age does a used car become too risky to buy?"collected July 13–16, 2026.
The tier comparison, how long Tier 1 and Tier 2 cars actually last, comes from Junk Car Medics' scrappage dataset of 75 vehicle models, tracking odometer readings and ages at the point of retirement. The mileage checkpoints were calculated using NHTSA's annual mileage schedule, which converts vehicle age into expected odometer readings. Remaining life at each checkpoint is simply what percentage of the car's typical retirement mileage it has not yet used.
One number to hold loosely: the dollar figures tied to the depreciation curve are illustrative. The $48,841 baseline was not independently verified. The shape of the curve, steep early, flat by year five, is the finding. The specific dollar amounts give it scale.
One number to take seriously: the year-five repair spike. The BLS sample for vehicles ages four through eleven runs between 400 and 635 households per year: large enough to treat the spike as a real signal, not statistical noise.
Sources: getafirstlife.com (depreciation) · MoneyGeek (new-car baseline) · BLS Consumer Expenditure Survey PUMD 2024 (repair costs) · RepairPal (cross-check) · Cash for Junk Cars Online / Junk Car Medics (scrappage data) · NHTSA Publication 809952 (mileage schedule) · iSeeCars (250k survival rates, separate statistic)