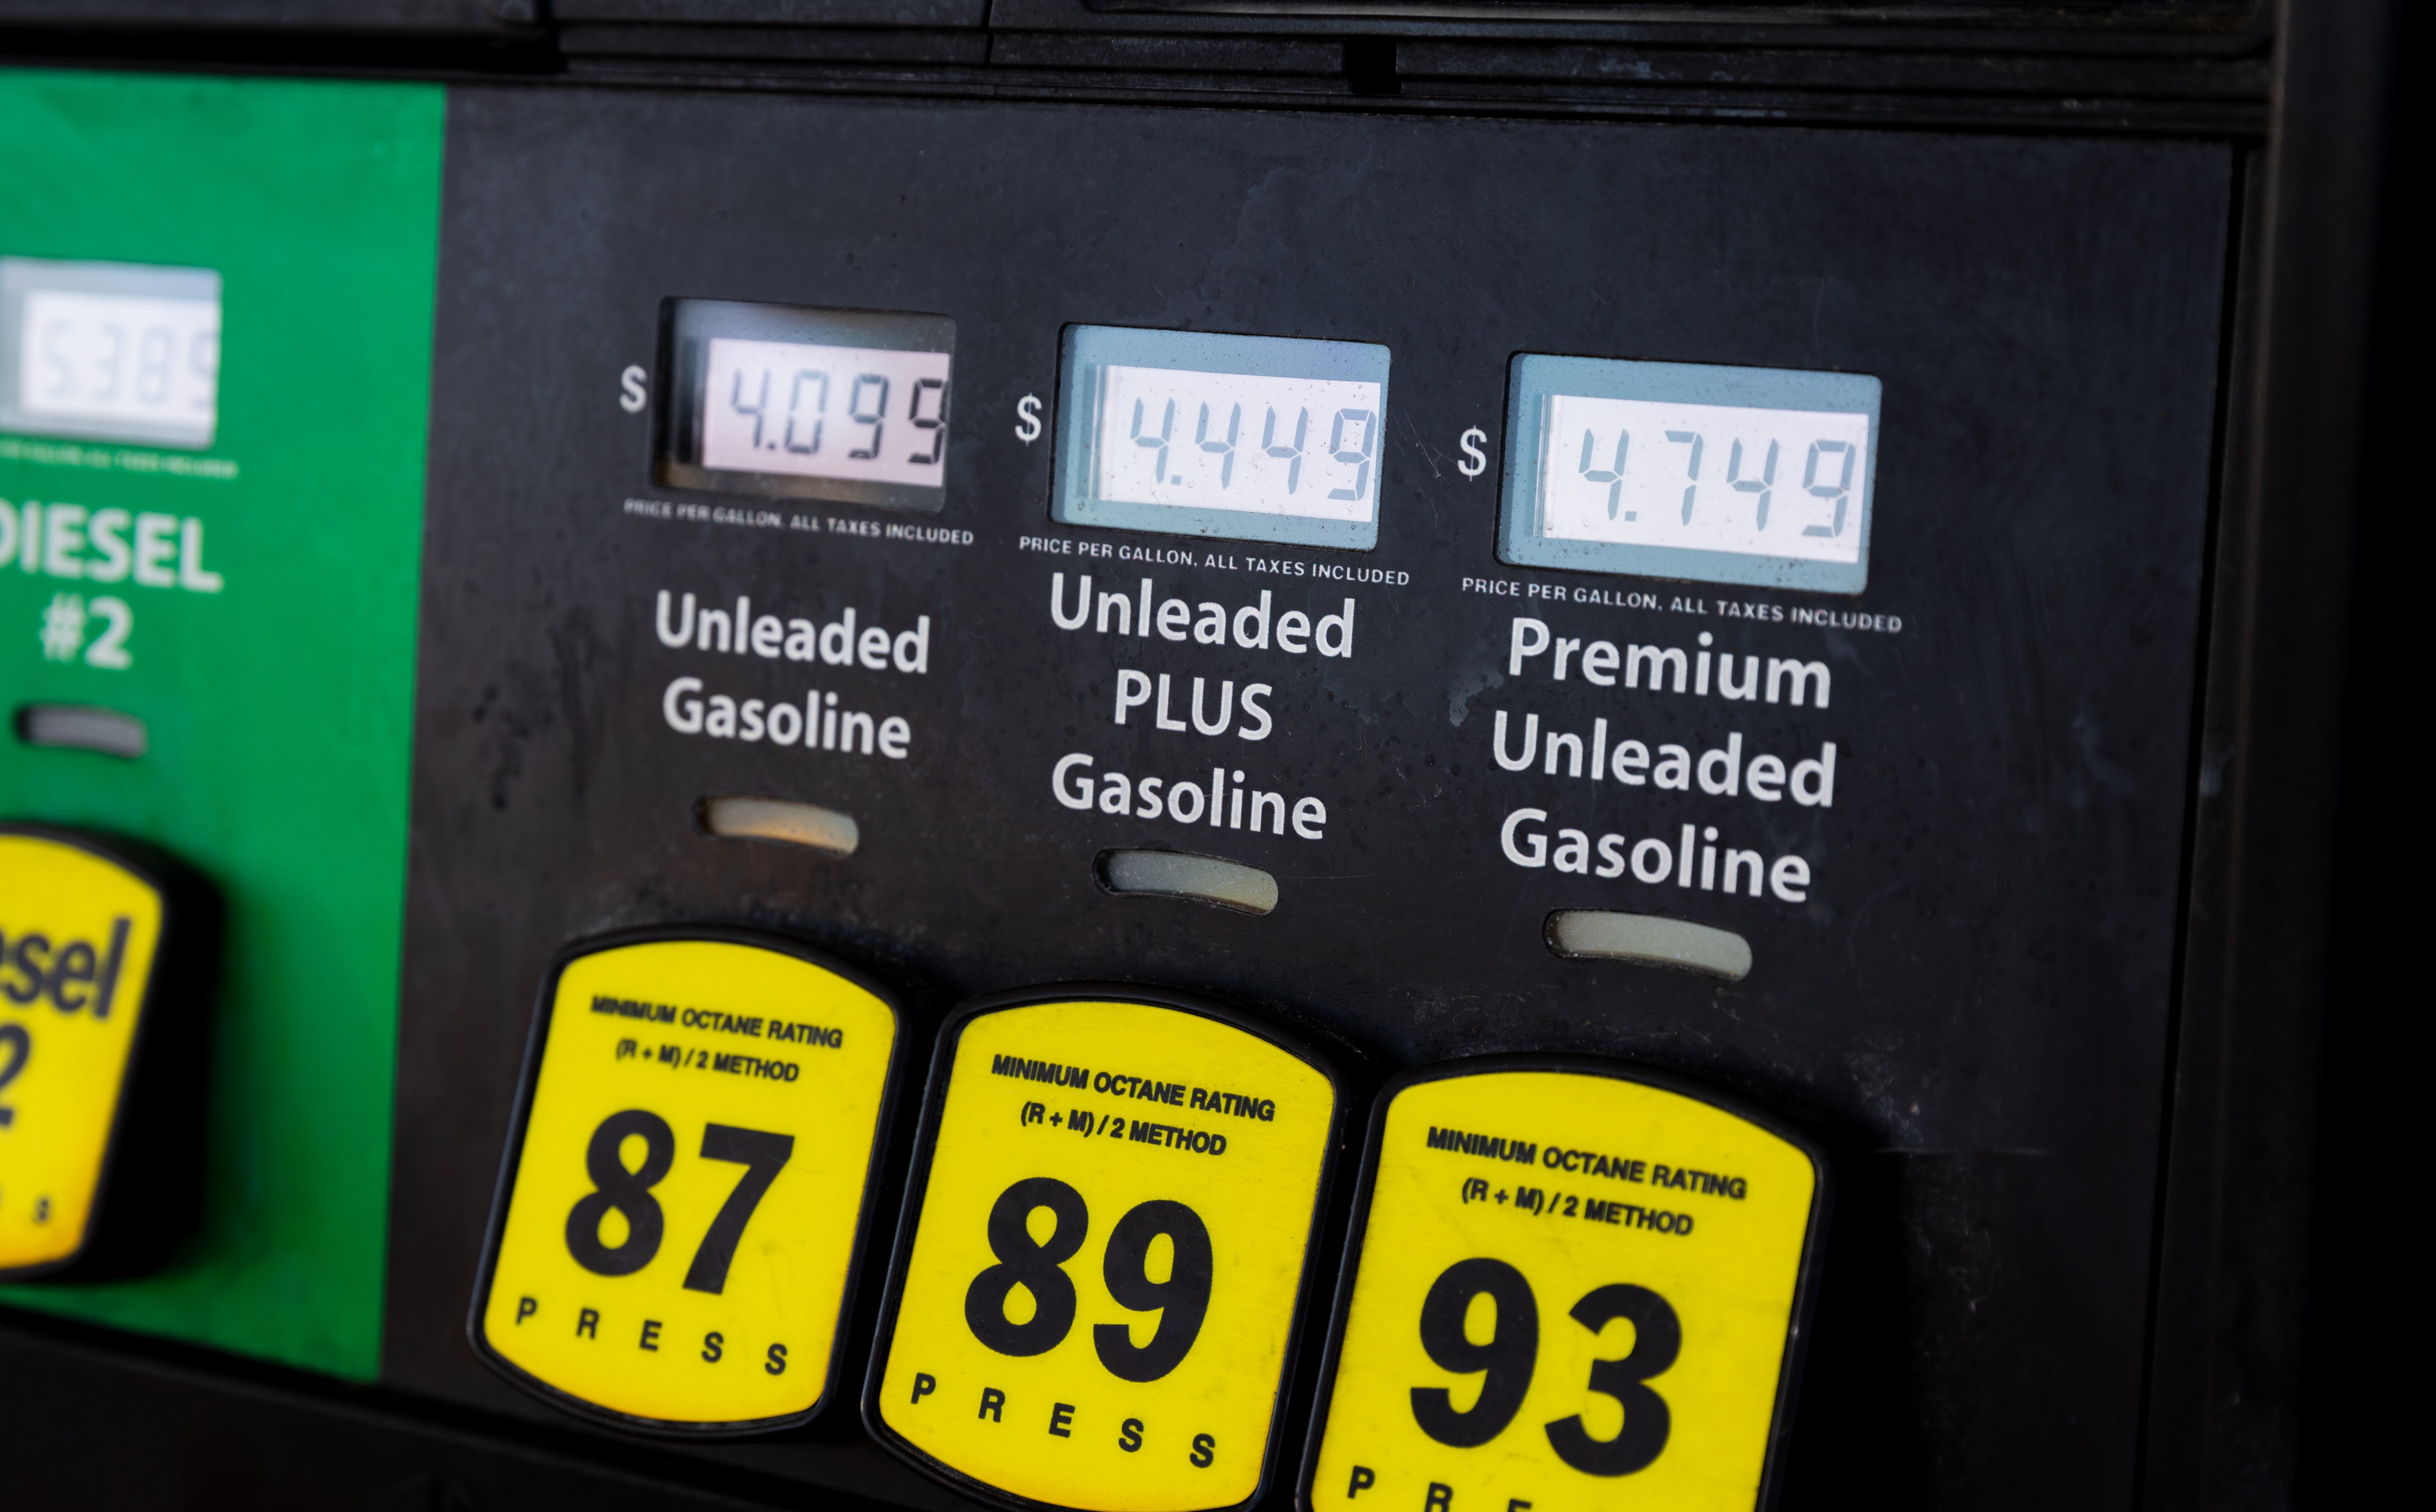
The sticker price for a used car doesn’t change when you cross a state line. The fuel bill does and most buyers never run the math before they sign.
You probably know that your location can affect how much you pay for a used car, but the price you pay up front isn’t the only amount that can vary based on where you live. Most people factor in car insurance pricing when considering their budget for a used vehicle, although one of the most overlooked costs that vary wildly depending on your location, is the price of fuel. Buy the identical vehicle in Wyoming and in Washington, D.C., and the fuel bill is not close. The Wyoming driver pays $3,161 a year in regular gas. The D.C. driver pays $1,554. Same car. Same fuel economy. A gap of $1,607 a year that has nothing to do with the vehicle and everything to do with where it is registered and driven.
That is the number most buyers never calculate. They price the car, they do not price the state.
Bumper analyzed the annual regular-gas cost of the average licensed driver in every state, using Federal Highway Administration (FHWA) mileage and licensed-driver data and a same-day snapshot of AAA regular gas prices. Before comparing a listing in one state against a listing in another, it is worth knowing which one is going to cost more just to drive. A Bumper vehicle history report surfaces a car’s specs and condition. We determined what the state itself is going to cost you.
The National Number
The average licensed driver in the United States spends $2,356 a year, or $196 a month, fueling a light vehicle with regular gas. That figure is driver-weighted — it reflects 12,193 miles and 520 gallons per driver annually, at a national average price of $4.528 a gallon*.
Rank | State | Annual cost | Monthly cost | vs. national avg. | Miles per driver | Gas price (per gal.) | Main reason |
|---|---|---|---|---|---|---|---|
1 | Wyoming | $3,161 | $263 | +34.2% | 16,413 | $4.513 | More miles driven |
2 | Alabama | $2,972 | $248 | +26.1% | 17,075 | $4.079 | More miles driven |
3 | Mississippi | $2,964 | $247 | +25.8% | 17,368 | $3.999 | More miles driven |
4 | New Mexico | $2,931 | $244 | +24.4% | 15,207 | $4.516 | More miles driven |
5 | Missouri | $2,857 | $238 | +21.2% | 16,065 | $4.167 | More miles driven |
6 | Kansas | $2,794 | $233 | +18.6% | 15,816 | $4.140 | More miles driven |
7 | Oklahoma | $2,755 | $230 | +16.9% | 15,682 | $4.117 | More miles driven |
8 | California | $2,754 | $230 | +16.9% | 10,139 | $6.365 | Pricier gas |
9 | Montana | $2,711 | $226 | +15.0% | 13,835 | $4.591 | More miles driven |
10 | Idaho | $2,636 | $220 | +11.9% | 12,374 | $4.992 | Pricier gas |
11 | Kentucky | $2,635 | $220 | +11.8% | 14,997 | $4.116 | More miles driven |
12 | Utah | $2,634 | $219 | +11.8% | 12,486 | $4.943 | Pricier gas |
13 | Vermont | $2,611 | $218 | +10.8% | 13,748 | $4.451 | More miles driven |
14 | Indiana | $2,611 | $218 | +10.8% | 15,760 | $3.882 | More miles driven |
15 | North Carolina | $2,610 | $218 | +10.8% | 14,772 | $4.141 | More miles driven |
16 | Nevada | $2,534 | $211 | +7.5% | 10,857 | $5.468 | Pricier gas |
17 | Wisconsin | $2,522 | $210 | +7.0% | 13,715 | $4.308 | More miles driven |
18 | Hawaii | $2,508 | $209 | +6.4% | 10,550 | $5.570 | Pricier gas |
19 | Georgia | $2,492 | $208 | +5.8% | 13,924 | $4.194 | More miles driven |
20 | North Dakota | $2,487 | $207 | +5.6% | 13,722 | $4.247 | More miles driven |
21 | Florida | $2,454 | $205 | +4.1% | 13,238 | $4.344 | More miles driven |
22 | Virginia | $2,452 | $204 | +4.0% | 13,602 | $4.223 | More miles driven |
23 | Nebraska | $2,430 | $202 | +3.1% | 13,123 | $4.339 | More miles driven |
24 | West Virginia | $2,395 | $200 | +1.6% | 12,866 | $4.362 | More miles driven |
25 | Louisiana | $2,379 | $198 | +1.0% | 13,878 | $4.017 | More miles driven |
26 | Maine | $2,368 | $197 | +0.5% | 12,524 | $4.431 | More miles driven |
27 | Michigan | $2,367 | $197 | +0.5% | 11,865 | $4.675 | Pricier gas |
28 | South Carolina | $2,365 | $197 | +0.3% | 13,511 | $4.101 | More miles driven |
29 | Minnesota | $2,319 | $193 | -1.6% | 12,547 | $4.331 | Cheaper gas |
30 | Texas | $2,313 | $193 | -1.8% | 13,835 | $3.918 | Cheaper gas |
31 | Tennessee | $2,310 | $193 | -2.0% | 13,414 | $4.036 | Cheaper gas |
32 | South Dakota | $2,303 | $192 | -2.3% | 12,671 | $4.259 | Cheaper gas |
33 | Maryland | $2,293 | $191 | -2.7% | 12,301 | $4.368 | Cheaper gas |
34 | Ohio | $2,242 | $187 | -4.9% | 12,171 | $4.315 | Cheaper gas |
35 | New Hampshire | $2,196 | $183 | -6.8% | 11,775 | $4.369 | Cheaper gas |
36 | Oregon | $2,183 | $182 | -7.3% | 10,087 | $5.072 | Fewer miles driven |
37 | Iowa | $2,182 | $182 | -7.4% | 11,995 | $4.263 | Cheaper gas |
38 | Massachusetts | $2,178 | $182 | -7.6% | 11,621 | $4.392 | Fewer miles driven |
39 | Arizona | $2,158 | $180 | -8.4% | 10,520 | $4.807 | Fewer miles driven |
40 | Washington | $2,140 | $178 | -9.2% | 9,067 | $5.531 | Fewer miles driven |
41 | Illinois | $2,101 | $175 | -10.8% | 10,303 | $4.778 | Fewer miles driven |
42 | Connecticut | $2,076 | $173 | -11.9% | 10,821 | $4.496 | Fewer miles driven |
43 | Alaska | $2,018 | $168 | -14.3% | 9,355 | $5.055 | Fewer miles driven |
44 | Colorado | $2,012 | $168 | -14.6% | 11,231 | $4.197 | Fewer miles driven |
45 | New Jersey | $1,978 | $165 | -16.1% | 10,580 | $4.381 | Fewer miles driven |
46 | Arkansas | $1,927 | $161 | -18.2% | 11,201 | $4.030 | Cheaper gas |
47 | Pennsylvania | $1,789 | $149 | -24.1% | 9,234 | $4.539 | Fewer miles driven |
48 | Delaware | $1,780 | $148 | -24.5% | 9,587 | $4.351 | Fewer miles driven |
49 | Rhode Island | $1,733 | $144 | -26.5% | 9,269 | $4.380 | Fewer miles driven |
50 | New York | $1,690 | $141 | -28.3% | 8,824 | $4.488 | Fewer miles driven |
51 | District of Columbia | $1,554 | $130 | -34.0% | 8,097 | $4.498 | Fewer miles driven |
National average | $2,356 | $196 | 12,193 | $4.528 |
The Turn: It’s Not the Car. It’s the Commute.
Every state runs on the same fuel-economy assumption. That is deliberate. It isolates the two things that actually vary state to state: how far the average driver has to go, and what they pay for gas when they get there.
The miles win, decisively. Across all 51 states (including D.C.), 36 (71% of them) land above or below the national average primarily because of how much driving the state requires. Only 15 states (29%) are explained primarily by gas price.
Mississippi makes the point bluntly. Its drivers log more miles than anyone in the country at 17,368 a year, the highest total in the dataset, while having the third-lowest gas prices in the nation. The mileage wins anyway. Even with affordable prices at the pump, the abundance of miles driven means that Mississippi lands as the third most expensive state in the country to fuel a car.
California runs the pattern in reverse. Its drivers log the ninth-fewest miles of any state. Its gas costs $6.365 a gallon, the highest price in the country, nearly 41% above the national average. The price wins. California still lands at #8 most expensive nationally, light driving and all.
A used car does not get more expensive to run because the state’s fleet is less efficient. It gets more expensive because the people drive further more often or gas is more expensive, or both.
Where Gas Prices Overpower the Mileage
The miles-driven pattern explains most of the country. It does not explain all of it. A small cluster of states breaks the pattern because their gas prices are so far outside the norm that no amount of light driving offsets them.
California (6.365/gal) and Hawaii (5.570/gal) are the two priciest gas markets in the country, and both sit in the top 20 most expensive states to fuel a car despite below-average mileage. Price, not distance, put them there.
Nevada (5.468/gal) and Washington (5.531/gal) carry the same price pressure. Washington’s drivers log the third-fewest miles in the nation, 9,067 a year, which is the only reason it isn’t ranked higher.
Arkansas runs the opposite way: cheap gas ($4.030/gal, the 47th-priciest in the country) is the reason it ranks among the cheaper states to fuel a car, even with slightly above-average mileage.
A used-car listing price tells you nothing about what the car will cost to run where you live. Two identical trims, one registered in Mississippi, one in New York, carry a $1,274-a-year difference in fuel cost alone, before financing, insurance, or maintenance enter the picture. Comparing listings across state lines without accounting for that gap is leaving out a big piece of the puzzle.
What to Check Before You Buy
The data above points to four questions worth answering before signing for a used car, especially one bought sight-unseen or across state lines.
- Check your state’s rank, not just the national average. If your state sits in the top third for miles driven per licensed driver, the national $2,356 figure is going to understate what you’ll actually pay. Budget from your state’s number, not the country’s.
- Separate a mileage problem from a price problem. A state with high miles and cheap gas (Mississippi, Alabama) rewards a more fuel-efficient vehicle. A state with low miles and expensive gas (California, Hawaii) rewards the same thing for a different reason, fewer gallons bought still means fewer dollars spent at a high per-gallon price.
- Re-run the math if you’re relocating. A buyer moving from D.C. to Wyoming should expect to budget roughly $1,600 more a year in gas for a comparable car driven almost entirely by the longer distances Wyoming requires, not the vehicle itself.
- Treat a gas-price outlier state differently than a high-mileage state. In California, Hawaii, Nevada, and Washington, no amount of careful driving offsets a price running 20–40% above the national average. In high-mileage states, the opposite holds: a more efficient vehicle buys back real money every year.
The Bottom Line
The sticker price of a used car does not change when you cross a state line. The cost of actually driving it is as much as $1,607 a year between states. For most of the country, that gap comes down to distance: how far residents typically drive annually, not how efficient the fleet is. For a handful of outlier states, it comes down to what’s at the pump.
Either way, it is a cost that shows up on every tank, for as long as you own the car. It is a cost everyone faces, but is not on the listing. Before you compare a used car’s price across state lines, run a Bumper vehicle history report on the specific vehicle, and weigh its specs against what your state is actually going to charge you to drive it.
Data & Methodology
Bumper estimated each state's annual fuel cost by taking how many miles the average driver puts on their car each year, dividing by how many miles a gallon of gas gets them, and multiplying by what gas cost on a single day (data pulled on September 28, 2026). The mileage and driver numbers come from the Federal Highway Administration; the gas price comes from AAA.
One important simplification: we used the same fuel-efficiency number (23.43 miles per gallon) for every state. That means this data can tell you which states drive more and which states pay more for gas.
* Light-vehicle miles (FHWA VM-2 × VM-4, 2024) ÷ licensed drivers (FHWA DL-22, 2024) ÷ 23.43 mpg (FHWA VM-1, 2024) × AAA regular gas price, 9/28/26 snapshot.